Monday, September 29, 2008

Attack of the clones (C# version)

How much do you know about the clones (apart from Star Wars stuff)? Chances are, if you ever participated in team effort developing software, you came across duplicate code, in most cases resulting from Copy/Paste magick. The best solution for finding duplicates in code is still manual code review – trusty efficient but time-consuming method. But one frequently wishes for an automated tool for that – and that’s where Clone Detective comes in. This is very interesting free tool that become available at CodePlex about a month ago and it purports to assist developers in identifying duplicate code in C# projects.

What is so exciting about this specific tool? Is that a first tool of its kind? Well, there are clone detection tools on the market; most are Java-oriented but some would work for more than one language. However, the tools I have tried were a) pretty clunky to operate, b) not integrated with IDE and c) cost money based on weird licenses (based on LOC processed etc.). Clone Detective on the other hand is a) easy to run, b) reasonably well integrated into VS and c) free. Thus it is very tempting to try!

How does the tool work? Clone Detective is essentially Visual Studio 2008 (no VS2005 support) integration front-end for ConQAT engine - COntinous Quality Assesment Toolkit, academic project by University of Munich. So when you run analysis of your code, Clone Detective will invoke ConQAT engine with the files, and will know how to process and present results in a meaningful way.

As many other academic projects, ConQAT engine is written in Java, which means you must have JRE installed (and JRE version must be higher than 1.5). Make sure you install JRE prior to Clone Detective, otherwise you will have to change the path to Java in tool settings (through “Tools->Options->Clone Detective” menu). This is an interesting twist – installing Java to analyze C# code, but remembering that the tool is free helps overcome the doubts at that stage :) 

Once Clone Detective package is installed, you will have three additional tool windows available through “View->Other Windows” menu in your VS 2008 IDE: “Clone Explorer”, “Clone Intersections” and “Clone Analysis” tool windows.

“Clone Explorer” tool window is the main entry point that you will use to run the analysis and review the high-level results of it. The results will consist of list of the files in the solution folder (separated into physical folders), where for each file there is indication of clones found; "Rollup" combo box allows selection of different metrics such as "Clone Percentage", "Number of Cloned Lines" etc.

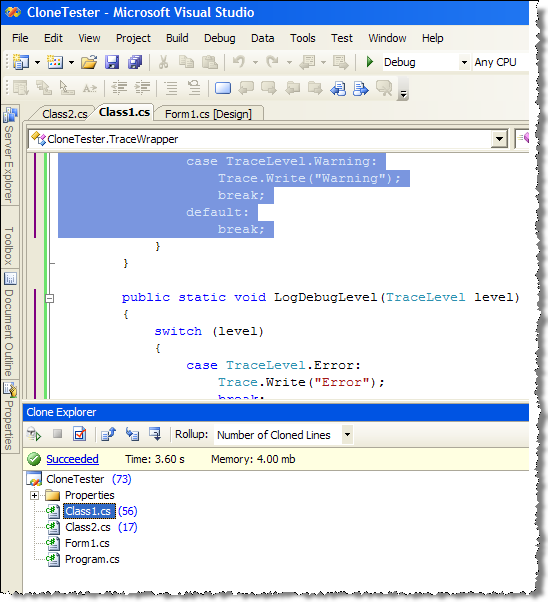
Double-clicking the file will open it in IDE with the clones detected highlighted with different color on the left margin of document window.

However, for better navigation one would use “Clone Intersection“ window, available by right-clicking on the specific file. This window displays cumulative color map for the clones in specific file on the top, and list of other files that contain clones from the selected file. Using color legend, one may view the distribution of clones within the file/across different files.

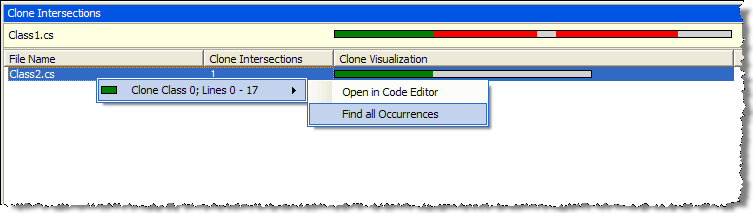
To drill down to specific clone, right-click on the color bar (either one on top or one on the right of the file), and select "Find all occurrences" - that will bring you “Clone Results” tool window to facilitate review of specific clone (double-clicking on the file will bring up IDE window with the focus on the clone and color coding on margin identifying the range of duplicated code).

Here is duplicated code found within the same file:

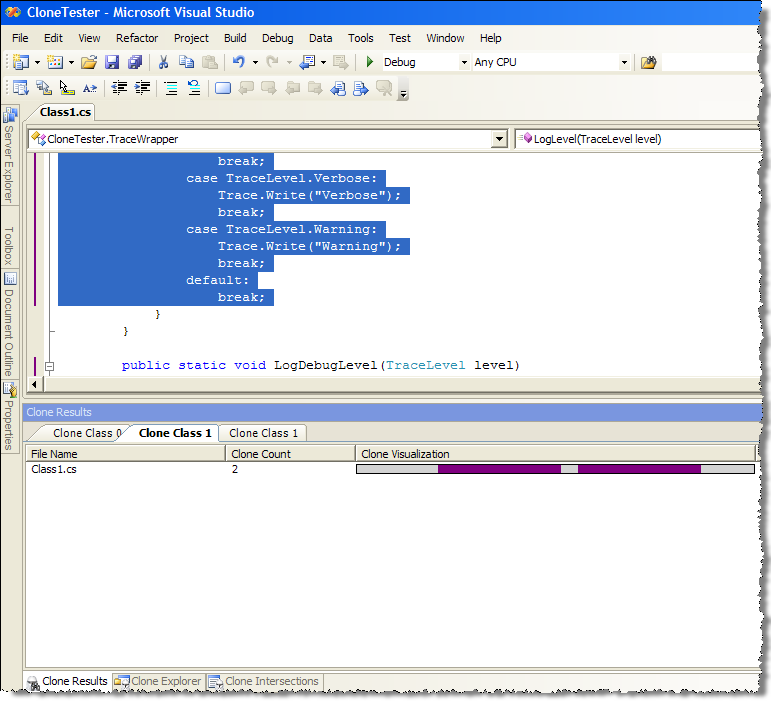
And here is the code duplicated across two files:

In a nutshell, that's the featureset of the tool (I did not mention the configuration, accessible from “Clone Explorer” window, which seems to hint on advanced fine-tuning options available).

One additional important point to be aware of is that the tool runs analysis on all files in the solution folder and all sub-folders and it does not require the files to be compiled; thus you may end up analyzing lots of files you did not want to. But perhaps that can be mended through settings.

To get some feel for how well the tool works I run some ad-hoc tests with Clone Detective, and here are my findings:

  1. On a basic C# project that I wrote for the purpose of testing, it did very good job identifying all clones that I have created "for the purpose", both in the same file and across two files
  2. On a real-life project (single assembly of ~ 20K LOC) with obviously bad code with high level of duplicity (due to no OOD principles applied and extensive copy-paste) the tool has identified the problems that were identified from code review. However, the tool was very useful to identify the scope of duplications across the solution, thus providing viable alternative to tedious manual code review. Did not see any false positives.
  3. On another real-life solution containing five assemblies (~35K LOC) it did considerably worse - run time was around 2 minutes, and it has mistakenly discovered 120K clones in one file of 2K LOC (file contained some static arrays initialization code). Some of other duplicates found were false positives (similar code but not duplicate functionality).

So in terms of success rate, I am still undecided and need to use it more to get certain benchmarks. But for a free tool it was easy to use and delivered on declared functionality (with some caveats).

On the problem side, it appears that running the tool on a large number of files may result in a huge amount of data to analyze; and the number of perceived clones may affect the analysis productivity. Thus integrating it into VS project build to be used throughout the development (a-la code analysis) and continuous build integration flow may be features to consider for the future.

Overall, Clone Detective may be well recommended for the test drive; I believe that it may be useful as part of the code review and overall development process.

Sunday, September 28, 2008

How to deal with areas or iterations using API

One relatively obscure area of TFS object model is area/iteration manipulation. Prompted by the question on how to delete area (btw, did you know how to use DeleteBranches for that) I decided to do a quick primer on area/iteration API and its usage.

First, how does one get areas/iteration list given the project (or parent node)? If you even started thinking about the areas or iterations, you will need to use ICommonStructureService service. This service encapsulates functionality related to TFS artifacts such as projects, areas and iterations (those are the common structures in its name).

Another important thing to know about this service is that most of its methods require artifact URIs as parameters. URI would consist of protocol (vstfs), type and unique identifier for the artifact; for example, for area it would be similar to "vstfs:///Classification/Node/[Guid]" (where Guid is unique ID for that area).

Let's start with a simple task of getting project's areas and iterations:

Dictionary<string, string> GetProjectAreas(string projectName)
{
    ICommonStructureService commonStructure = 
        _teamFoundationServer.GetService(typeof(ICommonStructureService)) 
            as ICommonStructureService;
    ProjectInfo project = commonStructure.GetProjectFromName(projectName);
    Dictionary<string, string> results = new Dictionary<string, string>();
 
    foreach (NodeInfo node in commonStructure.ListStructures(project.Uri))
    {
        // here will be more code
    }
    return results;
}

Note several aspects: creation of ICommonStructureService, conversion from project name to project URI and call to ListStructures method. Most important of those is ListStructures method – given project URI, it returns array of NodeInfo structures that holds all top level areas and iterations defined. NodeInfo itself provides host of properties such as node name, node path, node URI, parent URI and node structure type. Using the latter one may distinguish area node from iteration node (area StructureType is “ProjectModelHierarchy”, whereas for iteration it is “ProjectLifecycle”).

Common Structure Service (CSS) provides couple of handy methods to get NodeInfo structure either by node path (GetNodeFromPath) or by node URI (GetNode). However, most frequent task is to get subtree of nodes (areas of iterations) given project root node. For the top level nodes it can be easily done by using ListStructures; but to drill down into the tree one must use different approach, namely GetNodesXml method of CSS.

Code example below iterates over all root areas in project, and calls recursive function to retrieve all child areas and put them into dictionary of pairs (<area path>, <area URI>). First, I will change GetProjectAreas function code to include new function:

    foreach (NodeInfo node in commonStructure.ListStructures(project.Uri))
    {
        // more code
        if (node.StructureType != "ProjectModelHierarchy")
            continue;
        XmlElement nodeElement = 
            commonStructure.GetNodesXml(new string[] { node.Uri }, true);
        AddChildNodes(
            node.Name, nodeElement.ChildNodes[0], results);
    }

And now, iterate over the results recursively:

static void AddChildNodes(
    string parentPath, XmlNode parentNode, Dictionary<string, string> results)
{            
    results.Add(parentPath, parentNode.Attributes["NodeID"].Value);
 
    if (parentNode.ChildNodes[0] == null)
        return;
 
    foreach (XmlNode node in parentNode.ChildNodes[0].ChildNodes)
    {
        string nodePath = node.Attributes["Path"].Value;
        AddChildNodes(nodePath, node, results);                
    }
}

The example shows most features of GetNodesXml. It takes two parameters: array of root node URIs and boolean specifying whether to retrieve data for child nodes.

Then GetNodesXml returns hierarchical XML document, with every node in the return result represented as separate child “Node” XmlElement, with all properties as XML attributes (the attributes names and values correspond to NodeInfo properties). Raw XML for for area “Area 0” in project “Test Project” node will look similar to this (I removed actual GUID values for clarity):

<Node
  NodeID="vstfs:///Classification/Node/[guid 1]"
  Name="Area 0"
  ParentID="vstfs:///Classification/Node/[guid 2]"
  Path="\Test Project\Area\Area 0"
  ProjectID="vstfs:///Classification/TeamProject/[guid 3]"
  StructureType="ProjectModelHierarchy" />

Hierarchical means that if “Area 0”, for example, has any child areas, they will be contained in its Node XmlElement. Thus with the help of GetNodersXml it is possible to get the whole areas/iterations tree for specific project.

And to finalize review of CSS functionality that is relevant to areas/iterations, let’s have a look at other parts of C[R]UD.

How to create area/iteration? There is method CreateNode (that takes parent node URI and new node name); additionally, there is ImportBranch method that takes new node in the form of XmlElement  (XML should conform to CSS format, same as used by GetNodesXml above).

How to update area/iteration? For the purpose of rename one may use RenameNode method (supplying node URI and new name); to move the node (and all child nodes) one may use MoveBranch method (supplying node and parent URIs)

How to delete area (or iteration)? First, you need to get area/iteration URI (and that is covered in the beginning of the post). Next, you need to call method DeleteBranches of ICommonStructureService.


Sound simple, eh? However, the method takes two parameters: while first is easy to understand –  the array of node URI to delete, the second (named reclassifyUri) is far less obvious.

To understand how that parameter works, it would be helpful to refer to one of my past posts that talks about deleting area/iteration in Team Explorer UI.

Now, reclassifyUri is exactly that - the URI of the node to use in reassigning all work items associated with areas/iterations that are being deleted (or as MSDN succinctly puts it "URI of the node to which artifacts are reclassified").

In that post I tried to give quick survey of basics related to areas/iterations API. It is worth noting that CSS can be used for another important purpose of listing projects (for example, as demonstrated in James Manning blog post).

To conclude, some related links that may be of interest (mostly tools with the source code):

Thursday, September 25, 2008

Code Metrics color vs. Code Analysis warnings – what’s the difference?

Recently I have read an interesting question on MSDN forums:
“Why the color indications in Code Metrics Results tool window (red/yellow/green) are not in sync with Code Analysis warnings generated (when corresponding CA rules such as AvoidUnmaintainableCode are enabled)?”

It appears, that when Code Analysis warnings are fired on certain methods, the expectation might be that those methods will be marked as red/yellow in Code Metrics Results window.

The expectation is incorrect, since the color indication in Code Metrics Results window relates only to maintainability index (as described on FxCop blog) and therefore corresponds only to AvoidUnmaintainableCode warnings. Other CA warnings (such as AvoidExcessiveComplexity) may or may not cause the maintainability index to go into red/yellow range; each rule warning is fired when individual metric value falls into rule-specific range (as described in this helpful post). Thus while there is some correlation between Maintainability rules and Code Metrics Results tool window color coding it is not one to one.

Tuesday, September 23, 2008

Work Item customization tidbits: customization and global lists (part 11 of X)

In the previous post I have talked about setting up customization process, and I have received the question that merits separate post as the answer.

The question was – how do you figure in global lists into WI customization?

When you export WI type definition (either using witexport or Process Template Editor power tool), there are two options available:

1. Export WI type with no lists. This is the default mode of witexport; if you use PTE, you will be prompted (“Would you like to include the Global List definition?”)

2. Export WI type with lists (/exportgloballists parameter of witexport or answering yes on PTE prompt)

In the first case, the WI type XML file produced will not contain any lists but the fields will still reference the lists. In the second case, the WI type file will contain all (not only those referenced) global lists in addition to WI definition (and if you export that definition, these lists will get created as if you have used glimport).

In both cases, the WI type definition file will contain references to global lists. If you are going to put the file into version control (especially if you retain one copy of WI type definition for all similar Team Projects), reference Team Project specific lists (such as Builds list) ought to be removed. Then the only lists referenced will be ones global across different projects.

At any rate, including global lists definitions in WI type files is a bad idea, since when WIT is imported the global list defined inline will override the existing global list values.

Overall, I feel that it is much better to separate global lists from custom WI types. Also, it may be helpful to use some naming convention (for example, <Team Project name> - <list name>) to distinguish between lists specific to certain Team Project and truly “global”.

It is also worth to keep reusable lists in version control alongside with custom WI type definitions (especially when you have multiple TFS servers); that way you can easily (re-)create all required global lists with glimport before creating customized WI types (and that’s an important point here – global lists should exists before you create new Team Project that contains WIT referencing those global lists).

Personally, I never had too much trouble with global lists in customization context. Being pedantic and keeping in mind the points mentioned above worked for me most of time.

Related posts:
- Work Item Customization: customization process (part 10)
- Work Item Customization: customization tools (part 9)
- Work Item Customization: special fields (part 8)
- Work Item Customization: fields maintenance (part 7)
- Work Item Customization: global lists (part 6)
- Work Item Customization: system fields (part 5)
- Work Item Customization: user interface (part 4)
- Work Item Customization: state transitions (part 3)
- Work Item Customization: conditional field behavior (part 2)
- Work Item Customization: fields definition (part 1)

Friday, September 19, 2008

TODO or not TODO

Any person doing software development is often faced with the same problem: you come across some code that was developed as a quick’n’dirty answer to the project timetable (for speed reasons), or some code that works in convoluted way but could not be changed (for legacy reasons). What are your choices? One choice – you have time, skills and mandate from the management to fix the problems, revamp the architecture, refactor the code whenever you feel like doing it; so you just resolve the problem there and then. Another choice – you do not have time, do not own the code, have higher priority items etc., so you just put “TODO: Fix later” comment for later resolution.

After a (surprisingly long) while, I came to the conclusion that this traditional way of handling code problems is sadly inadequate. Seeing TODO comment in the middle of debugging session is pretty familiar sight; and there is a high chance that this very TODO is responsible for the problem you are looking for. But it is there already – so what is the problem? Short answer is that TODOs are rarely done; it is almost as if it is NEVER TODO.

And the problem is inherent in the TODO comment technique itself – code comments serve for code description, not for task tracking. And once you identified that something needs to be changed – that “something” becomes a task that should have priority, should be assigned to somebody, possible resolutions should be analyzed etc. All of which cannot be done in a code comment. And code comments do not have high visibility; if anything comment is always less visible in IDE that code; most IDEs provide extensive code navigation but hardly any comment navigation (As an anecdote on TODOs visibility, in an effort to improve it, I tried alternative technique of refactoring problem method/class names by adding telltale suffix in a belief that developers would be averse to using PerformCalculationCrap method or CustomListenerCrap class. I should tell you, having repulsive name did not affect the bad code proliferation at all :).

Thus one obvious solution is to create a task entity instead of in-place comment (if you use Team Foundation Server, that task readily maps to work item with all data formatting and reporting capabilities available there); create this entity separately from the code and ideally have it linked to the code in question. While the approach is easily the best one, it will not work well for everyone: certain overhead is involved (both with creation and maintenance of task artifacts; and at the very least it requires some task tracking system) that is not always justifiable; for example, you may still wish to mark the code for later review tomorrow morning without moving away from code here and now (after all, creating task artifact will necessitate context switch).

So nowadays I try not to use any TODO comments even in the absence of task tracking system; some alternative approaches (for Visual Studio 2005/2008) are summarized below. While not the replacement of tracking code issues in task tracking systems (and to say even more – design/architecture issues always MUST be tracked elsewhere), I believe in general these approaches work better than code comments, since they provide a) better visibility (visible in compilation log) and b) easy navigation (possible to navigate between issues) and c) require intentional action to suppress (you do not need to suppress comments at all).

And yes, I am aware that I am stretching the “intended usage” paradigm in most scenarios; all I can say is make the decisions depending on your specific scenario.

Alternative TODOs in C++

In C++ (both managed and unmanaged), the easiest way I have found is to use deprecated pragma directive. Given the method name as the parameter, the pragma will generate preprocessor warning for the method. Not so easy to ignore and easy to navigate to:

In theory, this pragma ought to be used to identify deprecated functions; however, in the projects I was a part of I have never seen it used for the declared purpose and thus it could be used as TODO indicator on methods. Of course, if on your project this pragma is used for its intended purpose, you won’t be able to use it. In such case, one may use less elegant approach; for example, the one below

#ifdef BACKLOG
   #error DoSomethingWrongWay is quick and dirty
#endif
void DoSomethingWrongWay(){ ... }

Once you define BACKLOG on your project, you can easily review and navigate the TODOs. While less elegant, in this manner you can mark any line of code (whereas using deprecated you can only label whole methods).

Alternative TODOs in C#

For C# there are two alternatives that I used in lieu of TODO comments.

First approach is to use #warning pragma. This way you can mark any line of code and then easily navigate between your TODOs.


Another way is to use Obsolete attribute (much like the usage of deprecated pragma in C++ discussed above); when attributed member is used, warning gets generated. However, since the attribute is widely used for its intended purpose, I try not to deviate from this intended usage, so it is more of the “caveat” rather than TODO comment. For example, if there is some crazy method that cannot be changed right away for legacy reasons, it can be labeled Obsolete so no one will be using it in the future (since using it will generate new warning right away).

Using traditional TODOs efficiently

If you are still not convinced, and prefer to use TODO comments in your code, there are still ways to use them in a more efficient manner in Visual Studio.

Just open “Task List” tool window, select “Comments” in the “Categories” combo box – and voila! You will immediately see all TODO comments in one list so you can easily navigate between them [by the way, the comments shown in the task list are not limited to TODO; one can define any comments to be shown there by changing settings in “Tools”->”Options”, “Environment”->”Task List”].


This feature would be even more useful if all files in currently open solution/project would be scanned. Currently only open files are scanned, which means search through files would still be a better method to iterate over all TODO comments in project.


After writing this post, I thought I’d do quick search on the subject; while I was not able to see what’s the prevalent opinion, I found an interesting blog post from Ben Pryor that argues similar point of view.


And by the way, TODO comments are not specific to any development methodology. I’d assume that is more of general phenomenon.


Have a strong opinion about the subject? Leave a comment!

Saturday, September 13, 2008

A Rule A Day: UseGenericEventHandlerInstances

Today I’d like to talk about one useful rule, which perhaps I should have mention in my previous post on “Declare event handlers correctly” rule.

The Design rule “Use Generic Event Handler Instances“ UseGenericEventHandlerInstances (CA1003) may be used to identify one of the points I have mentioned in my previous post, namely identify all custom delegate declarations that can be replaced with generic EventHandler<T> delegate.

If you are thinking about defining custom delegate for custom event handlers, the chances are your delegate will return void and will have two parameters - object as first parameter, and derivative of EventArgs as second parameters:

delegate void CustomEventHandler(object sender, CustomEventArgs e);

The only difference from EventHandler delegate definition is the custom second parameter:

delegate void EventHandler(object sender, EventArgs e);

The definition of CustomEventHandler above will violate UseGenericEventHandlerInstances rule; the suggested approach is not to define custom delegate but rather use generic EventHandler<T>. Using generic version of EventHandler allows for using custom event arguments and does not require additional delegate definition. To illustrate, the code that will violate the rule uses custom delegate definition:

public delegate void CustomEventHandler(object sender, CustomEventArgs e);
// violates the rule
 
public class EventProducer
{
    public event CustomEventHandler CustomEvent;
}
 
public class EventConsumer
{
    public void AttachEvent(EventProducer producer)
    {
        producer.CustomEvent += new CustomEventHandler(ProcessEvent);
    }
 
    private void ProcessEvent(object sender, CustomEventArgs e)
    {
        ...
    }
}

To fix the violation, the custom delegate declaration is removed and generic version of EventHandler is used:

public class EventProducer
{
    public event EventHandler<CustomEventArgs> CustomEvent;
}
 
public class EventConsumer
{
    public void AttachEvent(EventProducer producer)
    {
        producer.CustomEvent += new EventHandler<CustomEventArgs>(ProcessEvent);
    }
 
    private void ProcessEvent(object sender, CustomEventArgs e)
    {
        ...
    }
}

You may say it is not a big deal, whether to use custom delegate or template version of EventHandler. But that statement is true about generics at large – generics introduction in .NET 2.0 is mostly about more concise and more elegant (and as a consequence, more easily understood and maintainable) code. Using generic event handler instead of custom ones is yet another small step towards this goal.

Related posts
- Design CA1009 DeclareEventHandlersCorrectly
- Performance CA1810 InitializeReferenceTypeStaticFieldsInline
- Performance CA1822 MarkMembersAsStatic

Thursday, September 11, 2008

Work Item customization tidbits: customization process (part 10 of X)

In the previous post I have talked about the tools to modify Work Item type definitions. Today I’d like to relate to overall process of changing WIT definitions using those tools.

Are you sure that all of thirty Team Projects have the same WI definitions? How do you propagate the changes across project templates or live projects? How do you ensure that the latest change to WI is working? If you have definite answers to those questions, then you have something that may be nicknamed “process”; otherwise you are living on borrowed time and the disaster is waiting to happen.

Let me start with the development environment set up for Work Item type customization. Yes, that’s correct – authoring definitions in XML is not different from traditional writing software. If anything, it is easier to cause large scale problem across your company infrastructure with bad WI type than with custom developed tools (imagine as an example, that new bug definition cannot be saved due to the flaw in WIT logic, or bug cannot be closed, or the automatically update field values are not updated, and then project those examples on X, XX or XXX users environment).

The first principle of WI customization – never develop or deploy at the production server; have it first in the test environment. The easiest way to have test environment is to set up a Virtual PC image (or other virtual image) to work with; the hard thing with this approach being maintaining the image in sync with your production environment (unless you copy production environment into virtual image as needed and use it as your test environment; this approach is the best one when you have appropriate virtualization technology and hardware).

The second principle of WI customization – always verify that changed WI type logic does not break the existing data. That’s why I emphasized above the importance of test environment reflecting the production data; you must have the data you can test with. One frequent example of “breaking” customization is making certain previously obscure and not widely used field mandatory – suddenly every user saving existing work item is faced with updating that field.

And lastly, test custom WI type the same way you test the software. If you have specified twenty states and transitions between those states and defined conditional logic based on state transitions, now you have to achieve high “code coverage” on your definitions. It is worth to keep the future testing burden in mind when making implementation decisions. The testing become even more important if you choose to implement custom controls; in that case you actually develop custom code that needs to be tested and entails integration & deployment testing for your work item template.

Another important aspect of development process is version control. Make sure that every customized project template or WI type is stored in version control; that assures that rolling back changes or tracking changes history is possible and easy. Establishing version control repository update as a necessary step for production deployment also helps in fighting the temptation of committing changes directly to production environment (updating WI types online is a very dangerous feature of Process Template Editor; I’d recommend always using PTE in conjunction with version control and XML files).

Once the definitions are stored in version control repository, it is also easy to script automatic deployment of changed WIT across live Team Projects. I am talking about scenario where same change needs to be propagated across several Team Projects; if you use script (and store it in version control repository) you can document all changes performed and make sure that all required projects are updated.

And finally, very important aspect of customization is human factor. Theoretically, everyone with TFS Admin or Project Admin permissions may run witimport and update Work Item definitions (or use Process Template Editor to perform changes in UI). I’d strongly advise against set up where Work Item customization is performed by every team independently; for the reasons above custom work items development (as any software development) requires certain level of dedication and expertise. In the very least, I’d assign several persons to review changes prior to being deployed to production; after all, the database is shared between all teams.

To summarize, WIT customization process principles are:

  • Always perform development/initial deployment in the test environment
  • Make sure test environment have WI database similar/identical to production environment
  • Test custom WI types as you would test your software
  • Use version control on process templates and WI types; never deploy a definition that is not stored in repository first
  • Automate and document changes deployment
  • Establish clear roles and responsibilities

The overall process may seem cumbersome, too time-consuming and paranoid, but compare that with your software development. Software is not released untested, using appropriate test environment is paramount, developers need to have certain qualification etc. Why would Work Item customization be different? After all, it directly affects your daily development process and its efficiency.

Related posts:
- Work Item Customization: customization tools (part 9)
- Work Item Customization: special fields (part 8)
- Work Item Customization: fields maintenance (part 7)
- Work Item Customization: global lists (part 6)
- Work Item Customization: system fields (part 5)
- Work Item Customization: user interface (part 4)
- Work Item Customization: state transitions (part 3)
- Work Item Customization: conditional field behavior (part 2)
- Work Item Customization: fields definition (part 1)

Saturday, September 06, 2008

Short (positive) review of NDepend

After using NDepend (albeit rather episodically) for several years, I thought it would be only fair to talk about it, especially since static code analysis tools lately gained in importance and slowly but surely become standard part of development process. I came across the tool when I was doing active consulting work and at that time it was very helpful; so this somewhat informal survey will also repay its usefulness (since I used the free edition :).

For the purpose of this post I was using the version NDepend Professional 2.9.0 (thanks for the license to Patrick Smacchia).

The most interesting thing about NDepend is this: while most static code analysis tools for managed code (FxCop etc.) are used for identifying problems in code based on set of rigidly defined rules, NDepend takes altogether different approach. I am not even sure that NDepend should be called static code analysis tool – all right, it can be used for static code analysis in a manner similar to other tools, but it also has other uses that static code analysis tools lack.

NDepend is all about analysis, and under “analysis” I mean looking at different levels of detail in your project: from class/method/line of code level (similar to most other tools), to assembly level to the project (set of related assemblies) level. Those different levels are easily accessible thanks to NDepend innovative UI techniques in presenting information as well as its original approach of defining rules. You see, NDepend does not have rules as they defined, say, in FxCop. Instead NDepend calculates set of metrics on compiled managed code, that can be aggregated in different ways, and provides Code Query Language (CQL)  to query on metrics. Using metrics available and CQL, one gets high degree of flexibility with rules being defined as CQL queries. If you do not feel like authoring your own rules (or learning CQL), a decent set of pre-defined CQL queries is available out of the box.

To give an example of CQL-based rule (that serves the same purpose as FxCop rule CA1014 MarkAssembliesWithClsCompliant):

WARN IF Count > 0 IN SELECT ASSEMBLIES WHERE
!HasAttribute "OPTIONAL:System.CLSCompliantAttribute"
AND !IsFrameworkAssembly

Do you see the elegance of it? Not only the rule is readily modifiable, its definition is self-documenting (reading in pseudo-code “assembly is not attributed with ClsCompliant attribute and it is custom developed assembly”).

But that’s just one aspect of the tool – let me start with some screenshots to show off additional NDepend analysis capabilities.

Though NDepend provides command-line tool (as well as MSBuild tasks to run analysis as part of build script), you will want to use NDepend user interface, as it gives access to a lot of information in different cross-sections. UI is so flexible that some may say it is too flexible (meaning that one would need some time to get accustomed to NDepend UI and get the most of it).

The awesome feature that was part of NDepend from its very beginning is “Metrics view”. As they say, picture is worth thousand words

The largest rectangles correspond to assemblies, then assembly is made up of smaller rectangles corresponding to classes and finally every class is made up of rectangles corresponding to methods. The relative size of rectangles corresponds to calculated metric results for method/class/assembly. Metrics available range from simple ones (such as “number of IL instructions per method” or “Lines Of Code per method”) to calculated indexes (“Cyclomatic Complexity” or “Efferent Coupling”). When you mouse over the metrics map, the specific rectangles are highlighted and metric value for specific method is displayed.

This view is an awesome tool in itself, when you need to figure out the relative complexity of different classes, and especially so when dealing with unfamiliar code. You can use your favorite metric and immediately identify the most complex methods/classes by size.

Other useful view is the “Dependency matrix”. When you need to analyze set of assemblies used in the same project, one of the important questions to answer is the dependencies between assemblies. Do the presentation assemblies access data access layer directly, and not through business logic? And if yes, what are the members that are responsible for those “shortcuts”? To answer this kind of questions, the dependency matrix view is invaluable:

Note that the matrix above can be drilled down to namespace, classes and members level. Again, if you are trying to understand what are dependencies and dependents of certain assembly in a project, that’s the tool to use.

And now comes static code analysis part of tool. As I mentioned before, NDepend comes with set of predefined CQL queries that are roughly similar to, say, set of stock rules FxCop comes with. So you can run analysis on your assemblies right away using default rules.

Once you run analysis on your assemblies, NDepend will produce the detailed report (as HTML file) on your code that is not limited to rule violations (“CQL constraint violations” in NDepend terminology). In the report, you get to assess your code from different angles, and review the following:

  • Assemblies metrics (# IL instructions, LOC etc.)
  • Visual snapshot of code (same as available through “Metrics view”)
  • Abstractness vs. Instability graph for assemblies
  • Assemblies dependencies table and visual diagram
  • CQL Queries and Constraints; that’s parallel to traditional “static code analysis violations” view. However, due to the nature of CQL, you get to see exact definition of every rule together with violations – to me that’s very sweet as in that way CQL rule is somewhat self-documenting
  • Types metrics table that lists complexity rank, # IL instructions, LOC etc. in per method cross-section

However, you do not have to use the report – you may use UI to access the data in whatever way you desire. Two views that are of interest (in addition to previously mentioned “Metrics view” and “Dependency matrix”) are “CQL Queries” and “CQL Query Results”.

“CQL Queries” view is used to configure CQL queries to run during analysis (create/modify query groups, enable/disable specific queries or create/modify query contents)

That’s where you can author your own rules or review the definitions of pre-defined rules (using dedicated “CQL Editor” window)

“CQL Query results” view is used to show selected query results (“rule violations” in context of static code analysis terminology)

Note that there are statistics available for every CQL query that was run, that allow estimations against overall code base for that rule.

These two views provide all required functionality to access the results of analysis you have just performed. Myself, I use UI almost exclusively as for large projects the amount of data in HTML report may be overwhelming. However, the report will come in handy when you will have integrated NDepend into your automated build harness (and you can define custom XSL to fine tune report contents according to your needs)

Additionally, two features I wanted to mention is the ability to compare current analysis to historical analysis in the past (which is sadly lacking from most tools) and the availability of multiple flavors of NDepend application (console, stand-alone GUI, VS add-in, build tasks).

Now I’d like to give my personal opinion on when one would use NDepend over other alternatives.

NDepend may be your choice when

  • You start working at large existing [managed] code base that is largely unfamiliar to you. NDepend is the tool to figure out the complexity of what you are dealing with, analyze the impact of changes in one component across the project and identify potential “roach nests”
  • You are concerned with the quality of your code, and know exactly how to set up static code analysis for the project and what rules you’d like to have. Since all rules are based on human-readable query language, it is easy to figure out the rules meaning and to modify them/create new ones
  • You and your fellow developers are technical savvy perfectionist bunch and like to fine tune your code and continuously improve it. NDepend is powerful tool with great many features, but you are ready to spend time on learning its capabilities and adjusting your processes (such as code review)

NDepend may be not as compelling when

  • You (and your fellow developers) are new to static code analysis; moreover, implementing such practices has internal opponents in your company (that is, politics is a significant part of the process). In such case rich featureset may backfire; having a simpler tool such as FxCop would probably be easier to explain and integrate into the process.
  • You do not have need in analyzing your application interdependencies and components; the only thing you need is static code analysis with limited set of rules

If you looking for resources on having a deeper look into NDepend, the best one to start with is NDepend official site. It has both bunch of online demos and traditional documentation as well.

Another resource that you might want to check out, is a blog of NDepend creator’s, Patrick Smacchia. If you ever doubted how powerful the tool is, the blog will disperse your doubts. By the way, make no mistake about it – his blog is an awesome read even if you do not care about NDepend, since Patrick tackles general issues of software development just as often.

Important side-note if you are looking to introduce NDepend at your company: NDepend is now a commercial tool, which is freely available for trial, educational and open source development purposes. Have a look at the comparison between Trial and Professional Editions (for commercial use you are looking at Professional Edition license, and for trial, well, Trial Edition).

Thursday, September 04, 2008

Work Item customization tidbits: customization tools (part 9 of X)

After a short recess, it is time to get back on track with WIT customization topics – I still do not know how many parts I have yet to write!

Today I would like to talk about tools that can be used to modify Work Item types.

Before getting to the tools specifics, it is important to understand that Work Item types may be modified in two different manners.

The easiest way is to modify Work Item type definitions that are parts of Team Project template (for that you will need to export the template, modify it and then either import it back or create a new one) and create new Team Projects based off the modified template. In such manner, you can easily establish same project definitions across different projects.

However, in many (or perhaps even all) cases it is impossible to come up with perfect Work Item definition up front. Certain fields become deprecated or new ones need to be added, business logic changes, requirements to the data input are modified. That means that WI types will have to be updated both in the project template and in existing Team Projects.

For both of these approaches you have a choice of using either stock VS/TFS tools or additional toolset. The “standard” tools are as following

  • Process Template manager allows managing Work Item types as part of Team Project template (download existing template, and upload new template with WIT contained)
  • Command-line utilities witexport and witimport let you export existing Work Item type definition and import changed Work Item type to Team Project
  • Global lists can be managed by using glexport/glimport command-line utilities (see more on global lists in the previous post)

Using all of these tools involves editing Work Item type definitions XML files, and editing XML files requires intimate knowledge of the schema. An alternative to these tools is Process Template Editor which is distributed as part of Team Foundation Server Power Tools suite. Further in this post I will do a quick review of the features PTE has to offer.

Process Template Editor provides more than just editing of Work Item types. You can use it to author whole project template, WI types included (to learn more about using PTE for that, look for the extensive document on PTE features available it Power Tools folder – usually at location like “C:\Program Files\Microsoft Team Foundation Server 2008 Power Tools\Process Template Editor\PEUserGuide.doc”). I will concentrate only on WIT related functions.

Process Template Editor may be accessed only from Visual Studio tools menu:

Important feature of PTE that is visible right from the menu is disconnected mode: you can choose to work connected to Team Foundation Server (and load Work Item types, global lists etc. from the server) or disconnected (using local XML files with corresponding definitions).

Speaking of local XML files, PTE supports the same functions as provided by witimport/witexport and glimport/glexport (that is export of entities to and import of entities from file), which plays quite nicely with disconnected mode.

But no matter how you choose to access WI type (from local file or from server), WI type editor GUI is probably most important feature of PTE. The editor displays three tabs that handle different parts of WI definition schema.

“Fields” tab roughly maps to FIELDS section of WI type, and allows definition of fields and type-wide fields behaviors:

"Layout" tab maps to FORM section, and there you can define WI type UI. The awesome feature (that alone justifies usage of PTE in my eyes) is the ability to preview the form right after changing layout and without submitting changes to the server.

And the third tab, "Workflow" maps to WORKFLOW section in WI type and defines states, transitions and state-/transition-related fields behavior. The diagram can be used to visualize the future work item lifecycle:

Those three tabs together provide complete break up of WI type definition, so you can define the whole of WI in PTE - with one caveat is that some of the advanced attribute combinations may not work at all times; there were known bugs around certain scenarios (I highly recommend latest version of Power Tools due to multiple fixes in PTE as compared to VS2005 version). However, for visualization of workflow PTE cannot be beaten.

Simple and yet helpful UI is available for editing global lists (where you can define new list or modify contents of existing ones):

And finally, using PTE you can review available fields and their properties using Field Explorer (parallel to command-line witfields command):

Thus, using Process Template Editor one is able to achieve the same ends as with VS/command-line tools combination. Whichever tools you use is a matter of a personal preference; myself, I have found that using XML editor I can change WI type several times faster compared to PTE. However, for maintenance or review visual GUI of Process Template Editor is very helpful.

It is worth noting, that updating WI types at the server requires administrative permissions (Server or Project administrator). And that leads me to the topic for the next post, on how to manage the customization to work item templates responsibly. After all, managing WI data is on par (if not more important) with managing the source code assets.

Related posts:
- Work Item Customization: special fields (part 8)
- Work Item Customization: fields maintenance (part 7)
- Work Item Customization: global lists (part 6)
- Work Item Customization: system fields (part 5)
- Work Item Customization: user interface (part 4)
- Work Item Customization: state transitions (part 3)
- Work Item Customization: conditional field behavior (part 2)
- Work Item Customization: fields definition (part 1)

Monday, September 01, 2008

StyleCop 4.3 Checkin Policy available

In addition to recent release of StyleCop 4.3, Jason Allor has just released the documentation for extending StyleCop with custom rules (aka StyleCop SDK). CHM file contains information on writing custom rules, integration of StyleCop into build process and API reference.

Since new version of StyleCop includes many bug fixes as well as new rules and in the spirit of documented SDK available, I have updated the check-in policy for StyleCop 4.3. The changes include mostly namespace changes (to StyleCop from SourceAnalysis) as well as couple of fixes.

Please note that version 1.1 of policy is not compatible with the previous version; you will have to uninstall old version and reconfigure the Team Projects accordingly.

You can get either MSI installer or the source code. Both the compiled version and source code are provided AS IS with no warranties of any kind.

Related posts:
- Get New Version Of StyleCop
- StyleCop Confusion Cleared
- Source Analysis For C# Checkin Policy
- Source Analysis For C#: Custom Rules And More
- Beautify Your Code With Microsoft Source Analysis